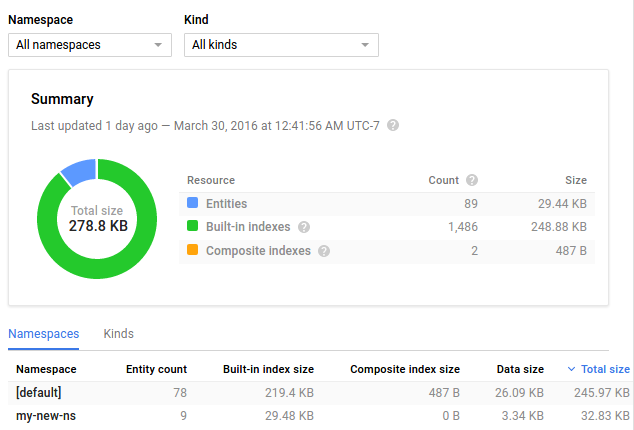
ここでは、Datastore のダッシュボードに表示される統計情報について説明します。
統計情報の表示
Datastore のダッシュボードにアプリケーションのデータの統計情報を表示します。
Google Cloud コンソールで [データベース] ページに移動します。
データベースのリストから、必要なデータベースを選択します。
ナビゲーション メニューで [Datastore Studio] をクリックします。

統計情報の種類
[ダッシュボード] ページには、さまざまな形式でデータが表示されます。
使用量をプロパティの型(文字列、倍精度浮動小数点数型、blob など)ごとに示した円グラフ。
使用量をエンティティの種類ごとに示した円グラフ。
プロパティの型ごとの合計使用量を示す表。[Metadata] のプロパティ型の使用容量は、プロパティが直接使用していないエントリに格納されているプロパティによる使用量を示します。[Datastore Stats] にエンティティが存在する場合、これはデータストア内の統計データ自体による使用容量を示します。
すべてのエンティティ、組み込みインデックス、複合インデックスの合計サイズ、平均サイズ、エントリ数、サイズを示すテーブル。
デフォルトでは、すべてのエンティティの統計データが円グラフに表示されます。プルダウン メニューからエンティティの種類を選択することで、指定した種類のエンティティだけが円グラフに表示されるようにすることができます。
統計情報のストレージ制限
統計データは、アプリケーションの Datastore インスタンスに保存されます。統計情報データの使用量は、アプリケーションが使用するエンティティの種類とプロパティの型の数に比例して増加します。名前空間を使用している場合、名前空間ごとに、名前空間の統計情報の完全なコピーが保存されます。統計情報の格納と更新で発生するオーバーヘッドを合理的な範囲に収めるため、統計情報エンティティは順次破棄されます。
統計情報データの詳細と Datastore が統計情報エンティティを順次破棄する方法については、Datastore モードの統計情報をご覧ください。
