查看應用程式要求的延遲時間
瞭解如何收集及查看應用程式的延遲時間資料:
使用 Google Cloud CLI 建立 Google Kubernetes Engine (GKE) 叢集。
下載範例應用程式並部署至叢集。
將 HTTP 要求傳送至範例應用程式,建立追蹤記錄。
找出建立的追蹤記錄,即可查看延遲時間資訊。
清除所用資源。
如要直接在 Google Cloud 控制台按照逐步指南操作,請按一下「Guide me」(逐步引導):
事前準備
-
貴機構定義的安全性限制,可能會導致您無法完成下列步驟。如需疑難排解資訊,請參閱「在受限的 Google Cloud 環境中開發應用程式」。
- Sign in to your Google Cloud account. If you're new to Google Cloud, create an account to evaluate how our products perform in real-world scenarios. New customers also get $300 in free credits to run, test, and deploy workloads.
-
In the Google Cloud console, on the project selector page, select or create a Google Cloud project.
Roles required to select or create a project
- Select a project: Selecting a project doesn't require a specific IAM role—you can select any project that you've been granted a role on.
-
Create a project: To create a project, you need the Project Creator
(
roles/resourcemanager.projectCreator), which contains theresourcemanager.projects.createpermission. Learn how to grant roles.
-
Verify that billing is enabled for your Google Cloud project.
-
Enable the Google Kubernetes Engine and Cloud Trace APIs.
Roles required to enable APIs
To enable APIs, you need the Service Usage Admin IAM role (
roles/serviceusage.serviceUsageAdmin), which contains theserviceusage.services.enablepermission. Learn how to grant roles. -
In the Google Cloud console, on the project selector page, select or create a Google Cloud project.
Roles required to select or create a project
- Select a project: Selecting a project doesn't require a specific IAM role—you can select any project that you've been granted a role on.
-
Create a project: To create a project, you need the Project Creator
(
roles/resourcemanager.projectCreator), which contains theresourcemanager.projects.createpermission. Learn how to grant roles.
-
Verify that billing is enabled for your Google Cloud project.
-
Enable the Google Kubernetes Engine and Cloud Trace APIs.
Roles required to enable APIs
To enable APIs, you need the Service Usage Admin IAM role (
roles/serviceusage.serviceUsageAdmin), which contains theserviceusage.services.enablepermission. Learn how to grant roles. 按一下工具列中的 terminal
「Activate Cloud Shell」(啟用 Cloud Shell) ,然後在 Cloud Shell 中執行以下步驟。 建立叢集:
gcloud container clusters create cloud-trace-demo --zone us-central1-c上述指令只需幾分鐘即可完成。該指令會在可用區
us-central1-c中建立名為cloud-trace-demo的標準叢集。將
kubectl設為自動重新整理憑證,即可使用與 Google Cloud CLI 相同的身分識別資訊:gcloud container clusters get-credentials cloud-trace-demo --zone us-central1-c驗證叢集存取權:
kubectl get nodes這個指令的範例輸出內容如下:
NAME STATUS ROLES AGE VERSION gke-cloud-trace-demo-default-pool-063c0416-113s Ready <none> 78s v1.22.12-gke.2300 gke-cloud-trace-demo-default-pool-063c0416-1n27 Ready <none> 79s v1.22.12-gke.2300 gke-cloud-trace-demo-default-pool-063c0416-frkd Ready <none> 78s v1.22.12-gke.2300從 GitHub 複製 Python 應用程式:
git clone https://github.com/GoogleCloudPlatform/python-docs-samples.git執行下列指令來部署範例應用程式:
cd python-docs-samples/trace/cloud-trace-demo-app-opentelemetry && ./setup.sh指令碼
setup.sh需要幾分鐘才會完成。這個指令碼會使用預建的映像檔設定三項服務,然後等候系統佈建所有資源。工作負載名稱為
cloud-trace-demo-a、cloud-trace-demo-b和cloud-trace-demo-c。這個指令的範例輸出內容如下:
deployment.apps/cloud-trace-demo-a is created service/cloud-trace-demo-a is created deployment.apps/cloud-trace-demo-b is created service/cloud-trace-demo-b is created deployment.apps/cloud-trace-demo-c is created service/cloud-trace-demo-c is created Wait for load balancer initialization complete...... Completed.-
前往 Google Cloud 控制台的「Trace Explorer」頁面:
您也可以透過搜尋列找到這個頁面。
以下螢幕截圖顯示多次執行
curl指令的結果。圖表會顯示「spans」(時距) 的匯總延遲時間資料,這些資料會說明追蹤記錄的子作業。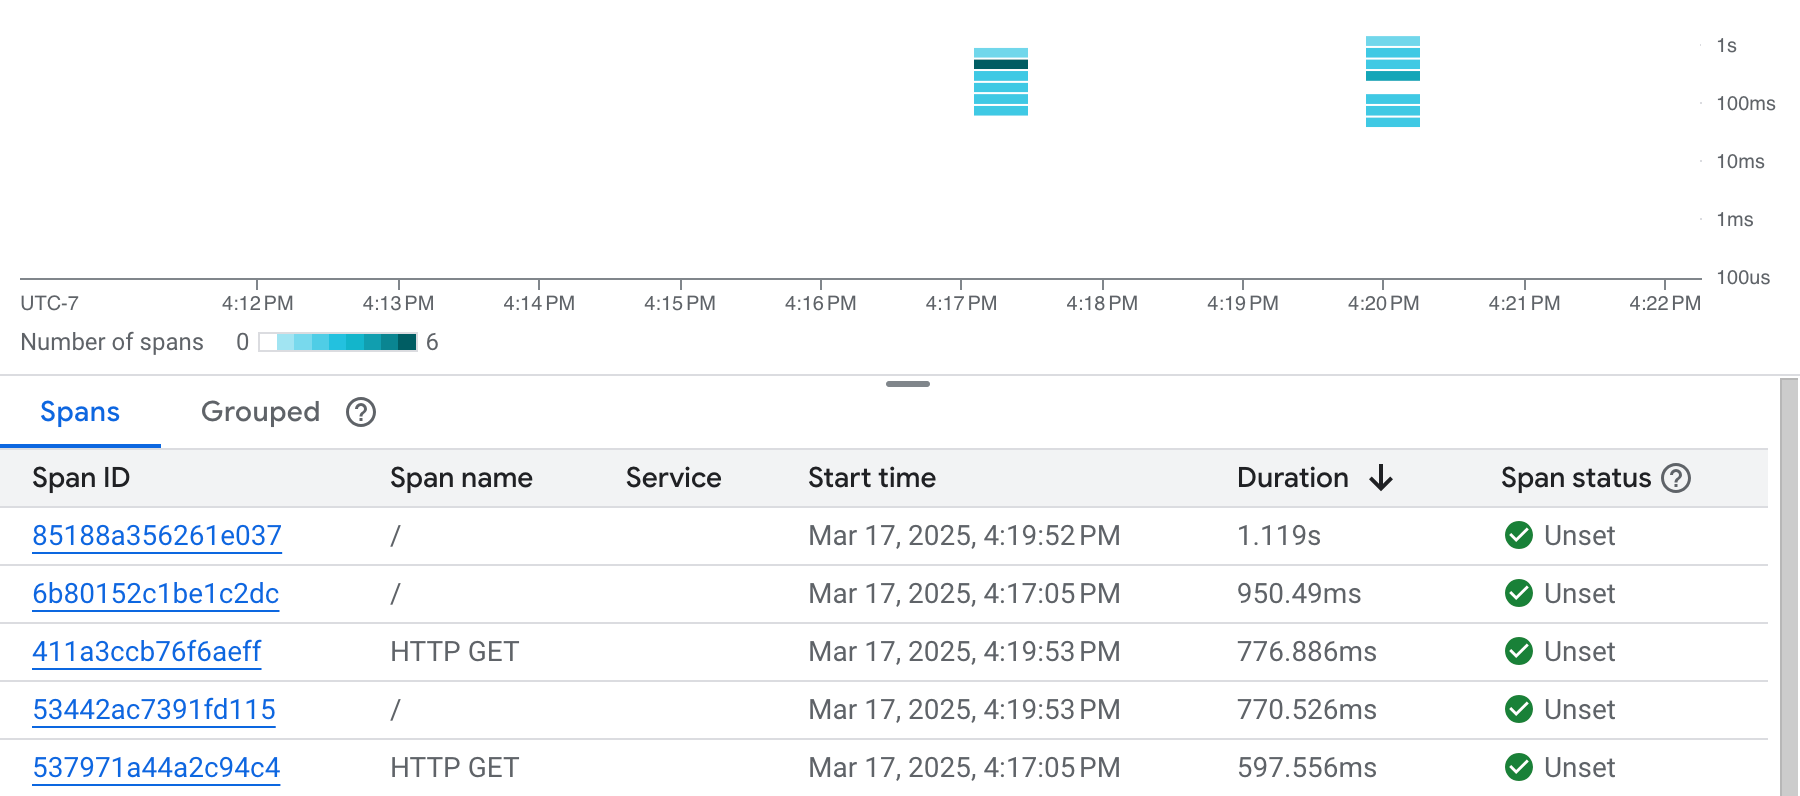
如要查看追蹤記錄詳情,請選取圖表中的時距或資料表中任一列。
追蹤記錄詳細資料對話方塊隨即開啟,如下列螢幕截圖所示:

甘特圖會顯示所選追蹤記錄的相關資訊。甘特圖的第一列代表追蹤記錄,後續每列則代表追蹤記錄中的一個時距。
在甘特圖中選取所需時距,即可查看相關詳細資訊。
應用程式會匯入多個 OpenTelemetry 套件:
應用程式會使用追蹤內容檢測網路要求,並自動追蹤 Flask 處理常式和其他服務的要求:
應用程式會將 Cloud Trace 匯出工具設為追蹤提供者,以 Cloud Trace 格式傳播追蹤內容:
下列程式碼片段顯示如何以 Python 傳送要求。OpenTelemetry 會透過傳送要求,隱含地為您傳播追蹤記錄內容:
kubectl會擷取名為cloud-trace-demo-a的服務 IP 位址。curl指令隨後會將 HTTP 要求傳送至服務a。- 服務
a收到 HTTP 要求,並將要求傳送至服務b。 - 服務
b收到 HTTP 要求,並將要求傳送至服務c。 - 服務
c會接收來自服務b的 HTTP 要求,並將字串Hello, I am service C傳回給服務b。 - 服務
b會收到服務c的回應,並將其附加至字串And I am service B,然後將結果傳回服務a。 - 服務
a會收到服務b的回應,並附加至字串Hello, I am service A。 - Cloud Shell 會列印服務
a的回應。
建立 GKE 叢集
本指南會建立標準 GKE 叢集。如果您使用 Google Kubernetes Engine 的 Autopilot 模式,或是啟用 Workload Identity Federation for GKE,則必須將應用程式設定為使用 Workload Identity Federation for GKE。
下載及部署應用程式
下載並部署 Python 應用程式,該應用程式使用 Flask 架構和 OpenTelemetry 套件。如要瞭解應用程式,請參閱本頁的「關於應用程式」部分。
在 Cloud Shell 中執行下列操作:
建立追蹤記錄資料
「追蹤記錄」會記錄應用程式完成單次作業所需的時間。
要建立追蹤記錄,請在 Cloud Shell 中執行下列指令:
curl $(kubectl get svc -o=jsonpath='{.items[?(@.metadata.name=="cloud-trace-demo-a")].status.loadBalancer.ingress[0].ip}')
上述指令的回應如下所示:
Hello, I am service A
And I am service B
Hello, I am service C
執行 curl 指令數次,即可產生多個追蹤記錄。
查看延遲時間資料
關於應用程式
本快速入門導覽課程使用的範例應用程式位於 GitHub 存放區。這個存放區包含如何在 Cloud Shell 以外的環境中使用應用程式的相關資訊。這個範例應用程式是以 Python 編寫,使用 Flask 架構和 OpenTelemetry 套件,並在 GKE 叢集上執行。
本指南會建立標準 GKE 叢集。如果您使用 Google Kubernetes Engine 的 Autopilot 模式,或是啟用 Workload Identity Federation for GKE,則必須將應用程式設定為使用 Workload Identity Federation for GKE。
檢測
GitHub 存放區中的 app.py 檔案包含擷取追蹤資料並傳送至 Google Cloud 專案所需的檢測:
申請流程
為求明確,本節中的服務名稱省略了 cloud-trace-demo。舉例來說,服務 cloud-trace-demo-c 會參照為 c。
這個應用程式會建立三個名為 a、b 和 c 的服務。服務 a 已設定為呼叫服務 b,服務 b 已設定為呼叫服務 c。如要進一步瞭解服務設定,請參閱 GitHub 存放區中的 YAML 檔案。
在本快速入門中,您向服務 a 發出 HTTP 要求時,使用了下列 curl 指令:
curl $(kubectl get svc -o=jsonpath='{.items[?(@.metadata.name=="cloud-trace-demo-a")].status.loadBalancer.ingress[0].ip}')
curl 指令的運作方式如下:
清除所用資源
如要避免系統向您的 Google Cloud 帳戶收取本頁所用資源的費用,請按照下列步驟操作。
如果您建立新專案,但現在已不再需要該項專案,請刪除專案。
如果您使用現有專案,請執行下列操作:
如要刪除叢集,請在 Cloud Shell 中執行下列指令:
gcloud container clusters delete cloud-trace-demo --zone us-central1-c
後續步驟
- 如需支援的語言和平台資訊,請參閱 Cloud Trace 總覽。
如要瞭解如何檢測應用程式,請參閱:
如要進一步瞭解「Trace Explorer」(追蹤記錄探索工具) 視窗,請參閱尋找及查看追蹤記錄。
如要進一步瞭解如何管理 GKE 叢集,請參閱 kubectl。