Cloud Monitoring can trigger an alert when a Service is on track to violate
an SLO. You can create an alerting policy based on the rate of consumption of your
error budget.
All alerts on error budgets have the same basic condition: a specified
percentage of the error budget for the
compliance period
is consumed in a lookback period, which is a time period, such as the previous
60 minutes. When you create the alerting policy, Cloud Service Mesh
automatically sets most of the conditions for the alert based on the settings in
the SLO. You specify the lookback period and the consumption percentage.
Determining what values you should set for the lookback period and consumption
percentage might take some trial and error. You could use the default lookback
period of 60 minutes as a starting point. To determine the consumption
percentage, monitor the service behavior to see what percentage of the total
error budget (over the compliance period) was consumed in the previous 60
minutes. You want to set the consumption percentage so that you don't burn more
error budget in the lookback period than you can afford, but you don't want to
set off an alert unnecessarily.
For example, suppose you created an SLO with the following name:
95% < 300ms Latency in Calendar Week
With this SLO, only 5% of the total number of requests in a week can have a
latency > 300ms. Hitting or exceeding 5% consumes your total error budget. If
you set the lookback period to one hour, each lookback period is 1/168 of your
compliance period (there are 168 hours in a week). To calculate the hourly
consumption percentage that doesn't exceed the total error budget for the week:
5% ÷ 168 ≈ 0.03%
Because latency for your Service can fluctuate depending on load or other
conditions, setting 0.03% as the consumption percentage might trigger
unnecessary alerts. You could start with a value twice that, or 0.06%, then
monitor your Service and adjust the value as needed.
Select the Google Cloud project from the drop-down list on the menu bar.
Click the service that you want to create an alerting policy for.
In the left navigation bar, click Health.
Click the SLO that you want to create an alerting policy for.
In the Current Status of SLO section on the right, click the
Create Alerting Policy link.
The Add condition dialog displays. Cloud Service Mesh
automatically populates the SLO Burn Rate condition based on the
settings in the SLO. You configure the SLO Burn Rate condition so that
you get an alert when the SLO's error budget is declining too rapidly. You
want to make sure that you get an alert before the SLO is out of error
budget.
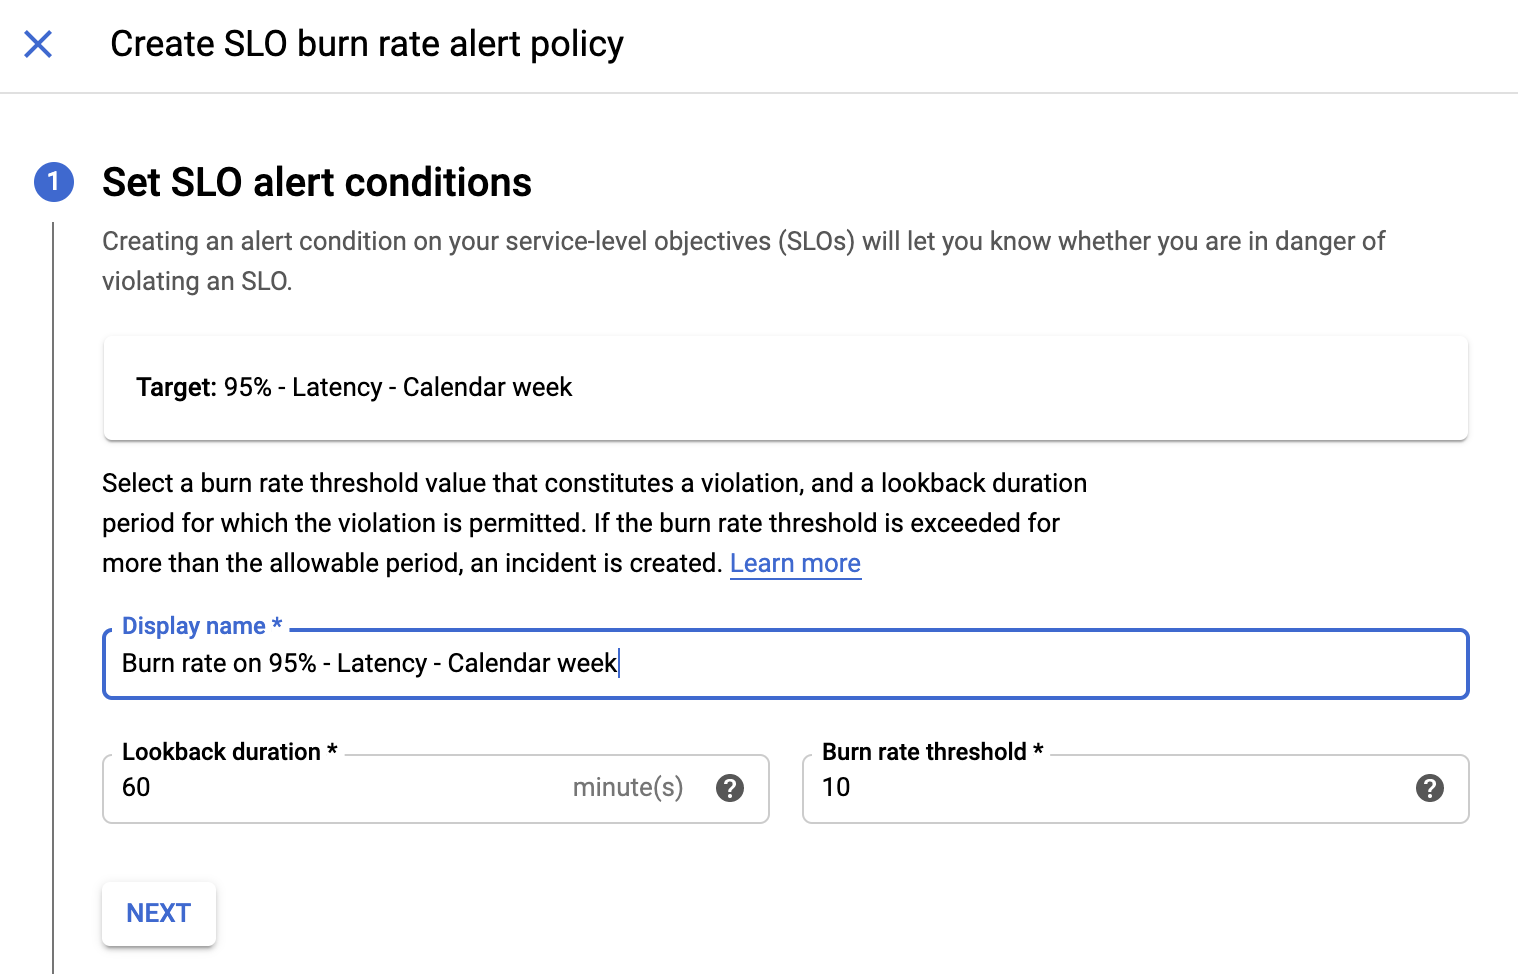
Configure the condition:
To name the condition, click the Suggested title link to use the
name based on your SLO, or enter a name for the condition.
In the Target section, enter the lookback period in the
Lookback Duration field, or use the default value.
In the Configuration section, enter the consumption percentage in
the Threshold field.
Click Save.
The Create new alerting policy window displays.
Configure the alerting policy:
Enter a policy name.
The condition is automatically populated, but you can optionally add
another condition.
If the alerting policy has only one condition, then leave the Policy
triggers field at the default value of Any condition is met.
Optionally, configure the Notifications and Documentation
sections. See
Managing alerting policies
for more information.
Click Save. The Policy details page is displayed.
To go back to the Cloud Service Mesh dashboard, click the
Navigation menudehaze and go to Anthos > Services.
What's next
Learn more about alerting from Site Reliability Engineering at Google:
[[["Easy to understand","easyToUnderstand","thumb-up"],["Solved my problem","solvedMyProblem","thumb-up"],["Other","otherUp","thumb-up"]],[["Hard to understand","hardToUnderstand","thumb-down"],["Incorrect information or sample code","incorrectInformationOrSampleCode","thumb-down"],["Missing the information/samples I need","missingTheInformationSamplesINeed","thumb-down"],["Other","otherDown","thumb-down"]],["Last updated 2025-08-28 UTC."],[],[],null,["# Creating an alerting policy for an SLO\n======================================\n\n| **Note:** This guide only supports Cloud Service Mesh with Istio APIs and does not support Google Cloud APIs. For more information see, [Cloud Service Mesh overview](/service-mesh/docs/overview).\n\nThis page describes how to create an alerting policy in Cloud Monitoring for\na service level objective (SLO) that you create in Cloud Service Mesh.\n\nFor an introduction to SLOs, see the\n[Service level objectives overview](/service-mesh/v1.21/docs/observability/slo-overview).\n\nCloud Monitoring can trigger an alert when a Service is on track to violate\nan SLO. You can create an alerting policy based on the rate of consumption of your\n[error budget](/service-mesh/v1.21/docs/observability/design-slo#error_budgets).\nAll alerts on error budgets have the same basic condition: a specified\npercentage of the error budget for the\n[compliance period](/service-mesh/v1.21/docs/observability/design-slo#compliance_periods)\nis consumed in a lookback period, which is a time period, such as the previous\n60 minutes. When you create the alerting policy, Cloud Service Mesh\nautomatically sets most of the conditions for the alert based on the settings in\nthe SLO. You specify the lookback period and the consumption percentage.\n\nDetermining what values you should set for the lookback period and consumption\npercentage might take some trial and error. You could use the default lookback\nperiod of 60 minutes as a starting point. To determine the consumption\npercentage, monitor the service behavior to see what percentage of the total\nerror budget (over the compliance period) was consumed in the previous 60\nminutes. You want to set the consumption percentage so that you don't burn more\nerror budget in the lookback period than you can afford, but you don't want to\nset off an alert unnecessarily.\n\nFor example, suppose you created an SLO with the following name:\n`95% \u003c 300ms Latency in Calendar Week`\n\nWith this SLO, only 5% of the total number of requests in a week can have a\nlatency \\\u003e 300ms. Hitting or exceeding 5% consumes your total error budget. If\nyou set the lookback period to one hour, each lookback period is `1/168` of your\ncompliance period (there are 168 hours in a week). To calculate the hourly\nconsumption percentage that doesn't exceed the total error budget for the week:\n`5%` ÷ `168` ≈ `0.03%`\n\nBecause latency for your Service can fluctuate depending on load or other\nconditions, setting 0.03% as the consumption percentage might trigger\nunnecessary alerts. You could start with a value twice that, or 0.06%, then\nmonitor your Service and adjust the value as needed.\n\nBefore you begin\n----------------\n\n[Create an SLO](/service-mesh/v1.21/docs/observability/create-slo) for one of\nyour Services.\n\nCreating an alerting policy on an SLO\n-------------------------------------\n\n1. Go to the **Health** tab for a service:\n\n 1. In the Google Cloud console, go to **Cloud Service Mesh**.\n\n [Go to Cloud Service Mesh](https://console.cloud.google.com/kubernetes/services)\n 2. Select the Google Cloud project from the drop-down list on the menu bar.\n\n 3. Click the service that you want to create an alerting policy for.\n\n 4. In the left navigation bar, click **Health**.\n\n2. Click the SLO that you want to create an alerting policy for.\n\n3. In the **Current Status of SLO** section on the right, click the\n **Create Alerting Policy** link.\n\n The **Add condition** dialog displays. Cloud Service Mesh\n automatically populates the **SLO Burn Rate** condition based on the\n settings in the SLO. You configure the **SLO Burn Rate** condition so that\n you get an alert when the SLO's error budget is declining too rapidly. You\n want to make sure that you get an alert before the SLO is out of error\n budget.\n\n4. Configure the condition:\n\n 1. To name the condition, click the **Suggested title** link to use the name based on your SLO, or enter a name for the condition.\n 2. In the **Target** section, enter the lookback period in the **Lookback Duration** field, or use the default value.\n 3. In the **Configuration** section, enter the consumption percentage in the **Threshold** field.\n 4. Click **Save** . The **Create new alerting policy** window displays.\n5. Configure the alerting policy:\n\n 1. Enter a policy name.\n 2. The condition is automatically populated, but you can optionally add another condition.\n 3. If the alerting policy has only one condition, then leave the **Policy\n triggers** field at the default value of **Any condition is met**.\n 4. Optionally, configure the **Notifications** and **Documentation** sections. See [Managing alerting policies](/monitoring/alerts/using-alerting-ui) for more information.\n 5. Click **Save** . The **Policy details** page is displayed.\n 6. To go back to the **Cloud Service Mesh** dashboard, click the **Navigation menu** *dehaze* and go to **Anthos** \\\u003e **Services**.\n\nWhat's next\n-----------\n\n- Learn more about alerting from Site Reliability Engineering at Google:\n\n - [Site Reliability Engineering](https://sre.google/sre-book/practical-alerting/)\n - [The Site Reliability Workbook](https://sre.google/workbook/alerting-on-slos/)"]]