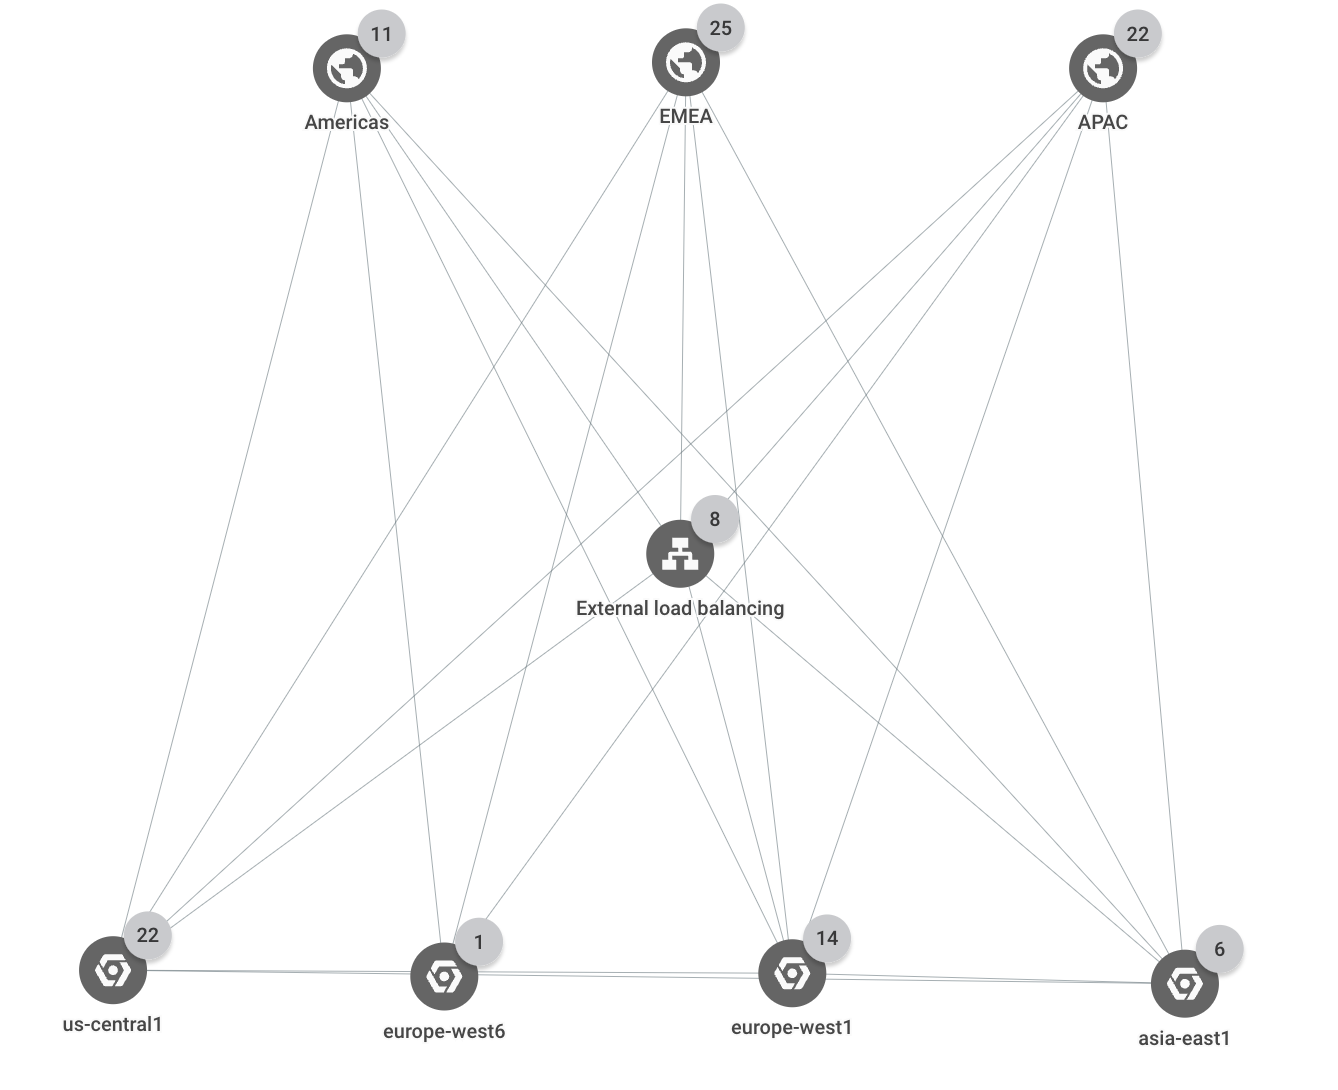
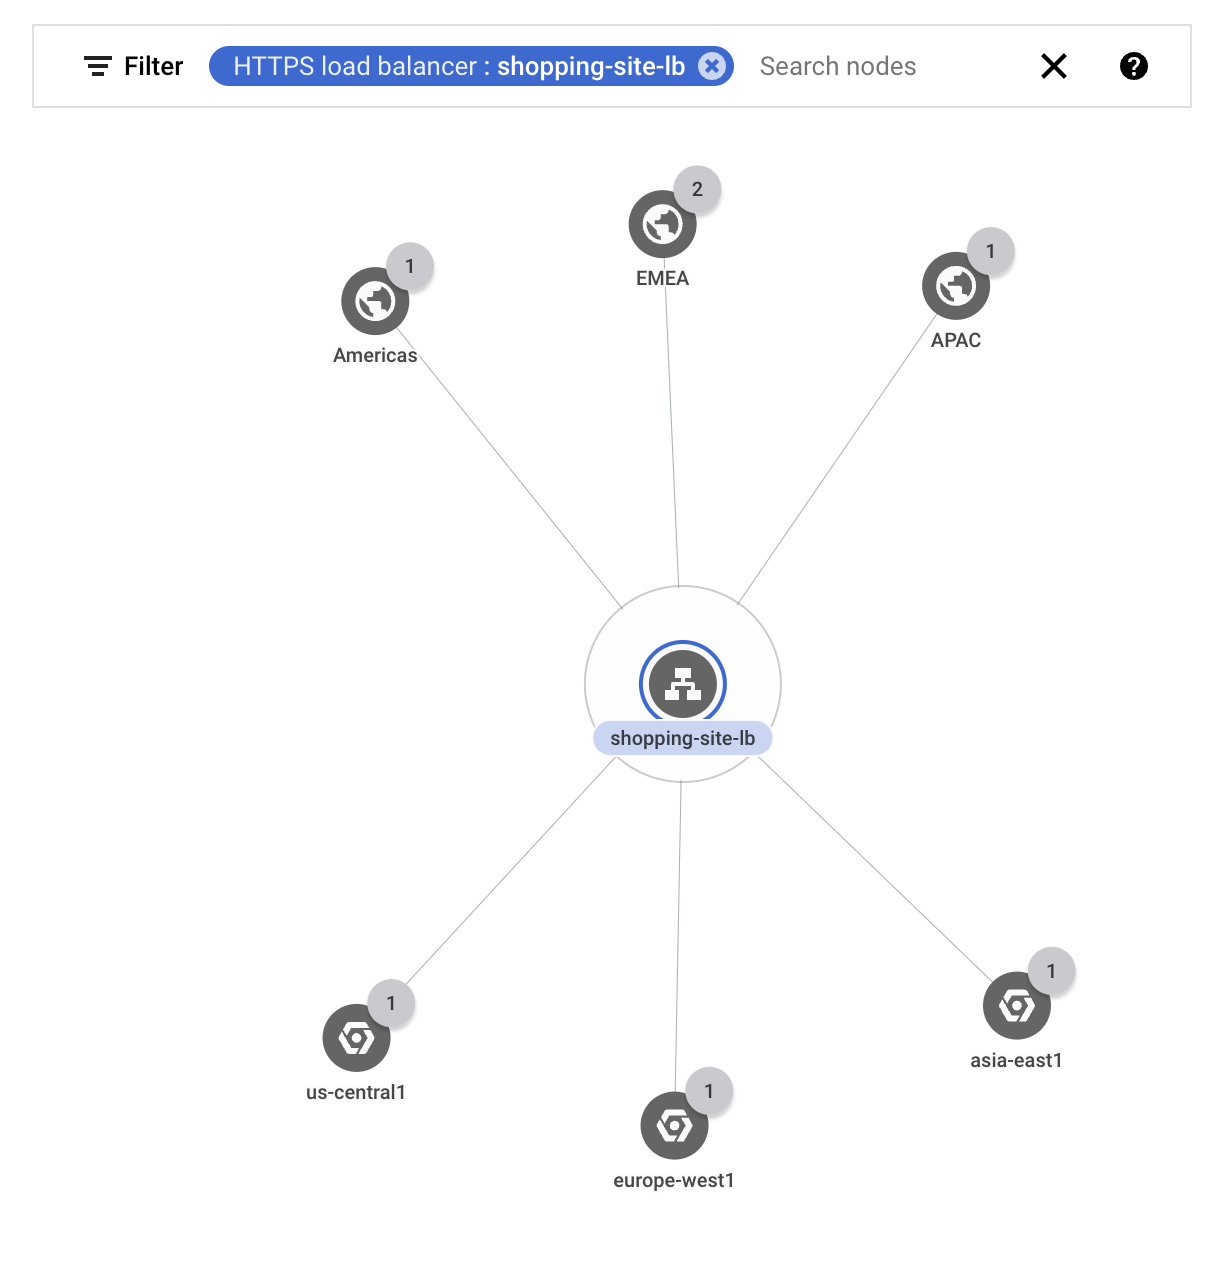
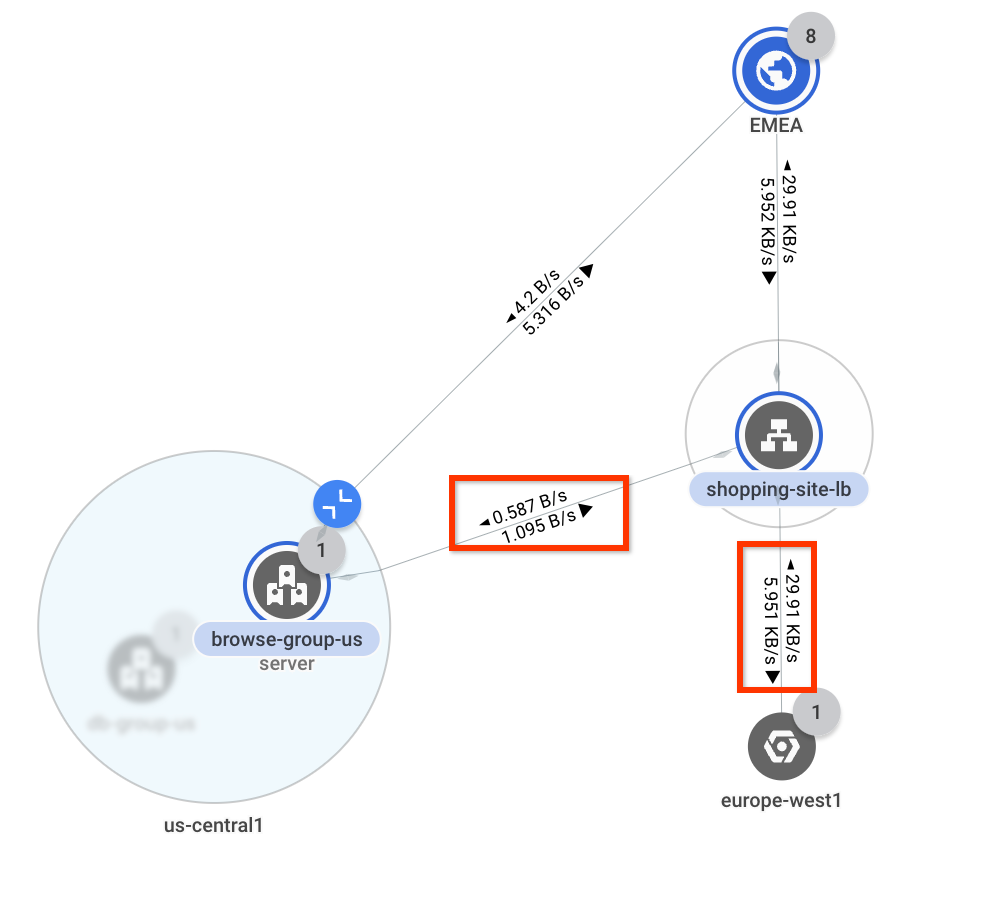
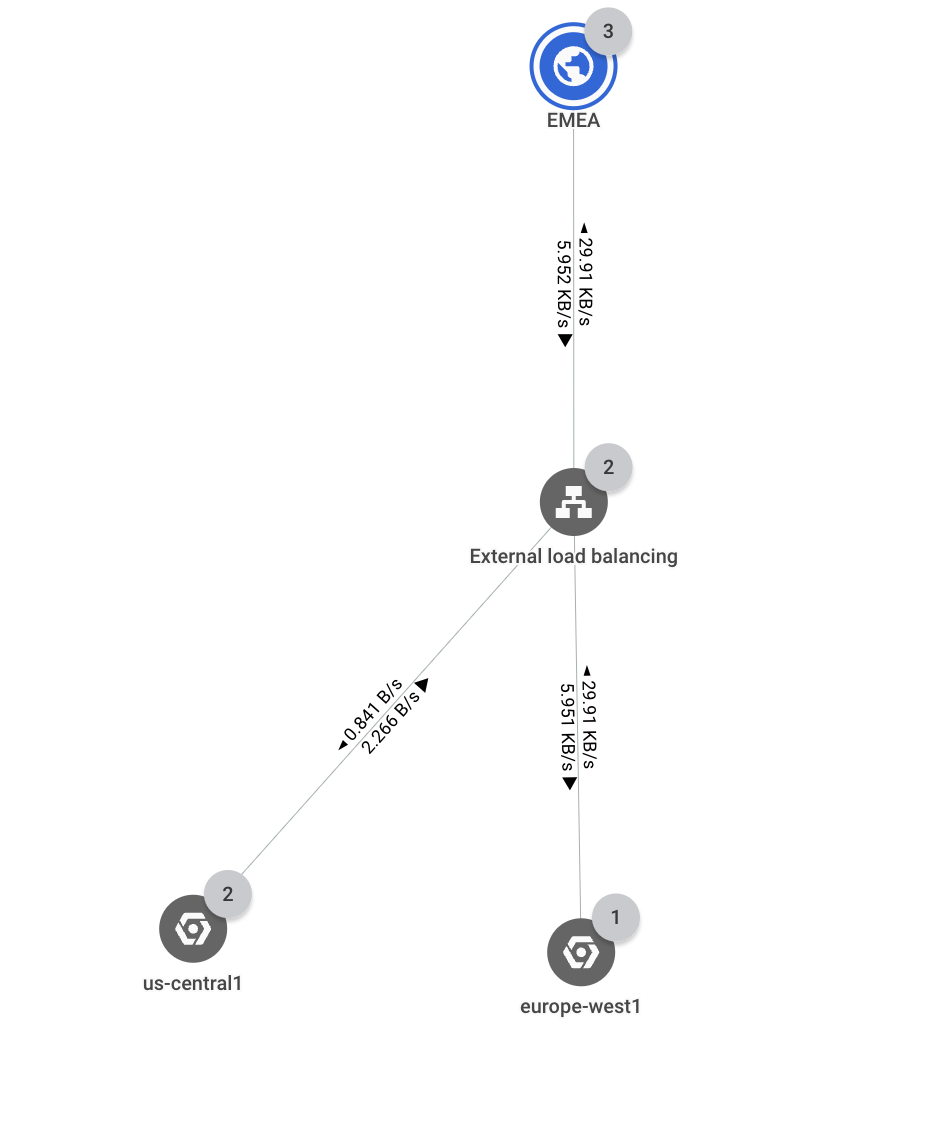
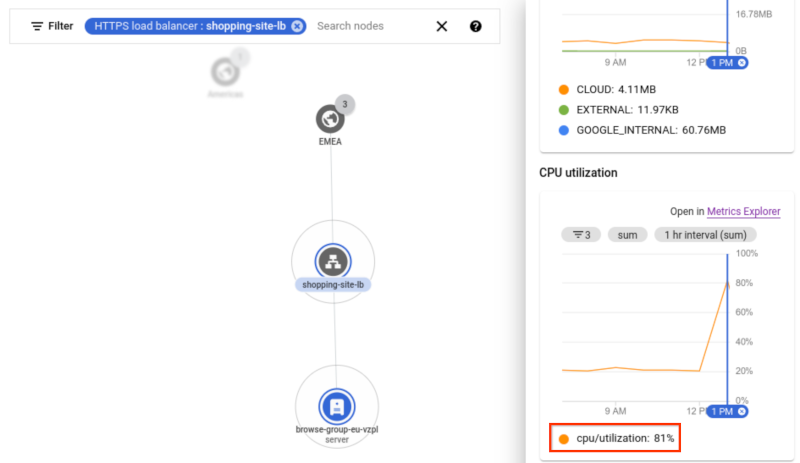
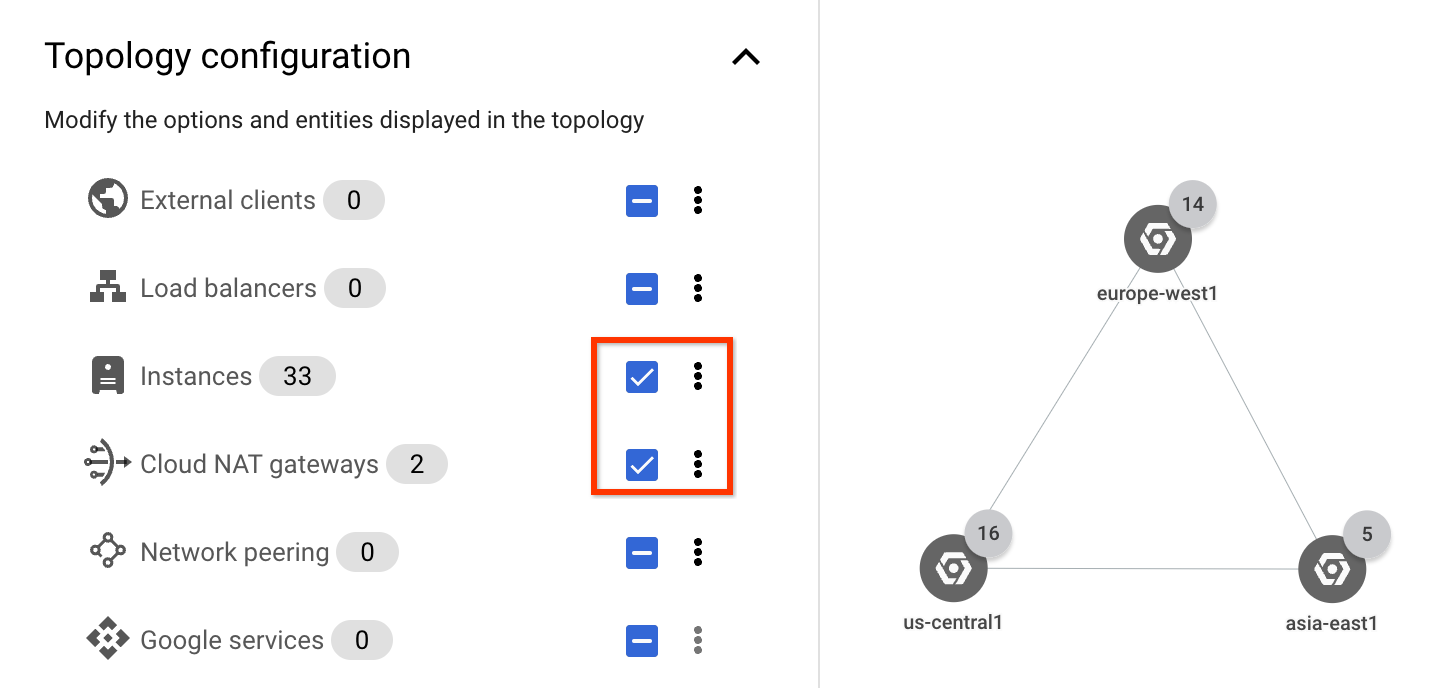
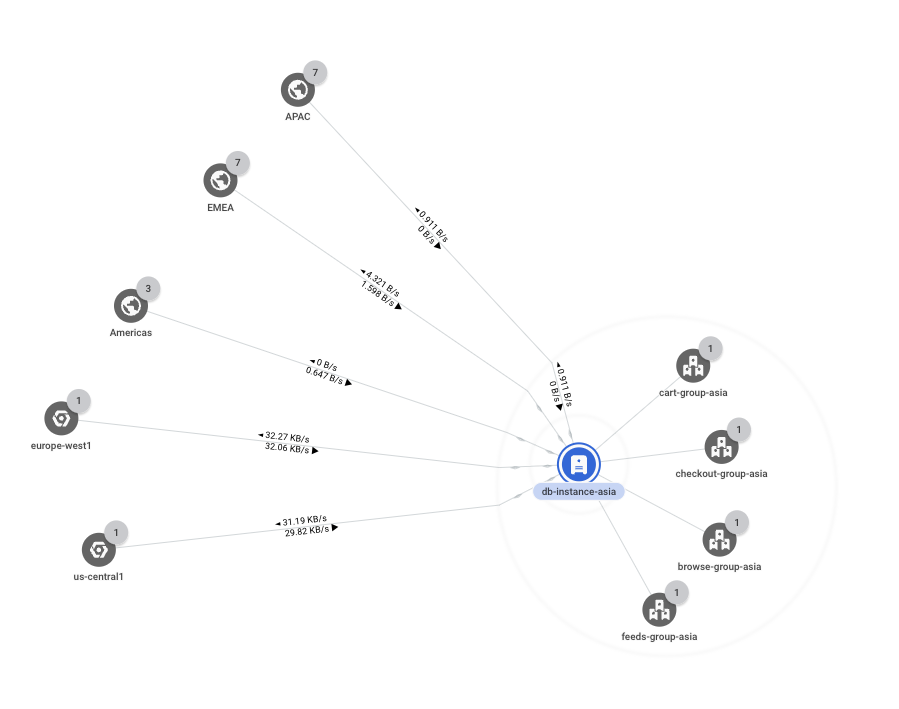
[[["易于理解","easyToUnderstand","thumb-up"],["解决了我的问题","solvedMyProblem","thumb-up"],["其他","otherUp","thumb-up"]],[["很难理解","hardToUnderstand","thumb-down"],["信息或示例代码不正确","incorrectInformationOrSampleCode","thumb-down"],["没有我需要的信息/示例","missingTheInformationSamplesINeed","thumb-down"],["翻译问题","translationIssue","thumb-down"],["其他","otherDown","thumb-down"]],["最后更新时间 (UTC):2025-08-25。"],[],[],null,["# Use case: Audit network performance\n===================================\n\nAssume that you're a network administrator who supports a network that includes\nseveral load-balanced applications. You've been asked to audit the network\nconfigurations that support those applications to ensure that the configurations\nare consistent with the expected state of your network. By doing this audit, you\ncan ensure that customers are getting the lowest possible latency to your\napplications.\n\nThe following use case demonstrates how Network Topology can help you\ncheck your existing configurations. For example, you can check that all client\nrequests are being served by application instances from the Google Cloud\nregion that's closest to the client. You can also ensure that cross-region\ntraffic is low because that traffic comes from databases that replicate data\nglobally.\n\nTopology overview\n-----------------\n\nThe deployment spans three Google Cloud regions (`us-central1`,\n`europe-west1`, and `asia-east1`). All external client requests are served by a\nsingle external Application Load Balancer that has multiple backends in each of the three\nregions. Client requests that come from one of three business regions (Americas,\nEMEA, and APAC) are served by application instances in the closest\nGoogle Cloud region.\n\nThe following graph shows the top-level hierarchy for the deployment.\n[](/static/network-intelligence-center/docs/network-topology/images/use-cases/auditing-topology.png) Network Topology example topology (click to enlarge)\n\n### Resources and traffic paths\n\nIn this example, the project contains the following Google Cloud\nresources:\n\n- 1 HTTPS load balancer\n\n- 4 backend services: `browse`, `shopping_cart`, `checkout`, and `feeds`\n\n- 12 instance groups (which are the load balancer's backends)\n\n There is one instance group for each backend service in each of the three\n regions.\n- 3 database instances, one in each region\n\nYou expect that traffic from certain countries goes to the following\nlocations:\n\n- Traffic from countries in the `Americas` business region goes to backends in the `us-central1` region. For example, traffic from an external client in Canada travels through the load balancer to the `checkout` backend in the `us-central1` region.\n- Traffic from countries in the `EMEA` business region goes to backends in the `europe-west1` region. For example, traffic from an external client in Poland travels through the load balancer to the `checkout` backend in the `europe-west1` region.\n- Traffic from countries in the `APAC` business region goes to backends in the `asia-east1` region. For example, traffic from an external client in Japan travels through the load balancer to the `checkout` backend in the `asia-east1` region.\n- Traffic to a database instance comes from a backend in the same region. For example, the backends in `asia-east1` send data only to the database instance in `asia-east1`.\n- Cross-region traffic is limited to database replication. For example, traffic between `us-central1` and `europe-west1` travels only between database instances in those regions.\n\nUnexpected traffic flow\n-----------------------\n\nIn this scenario, you discover that traffic from the `EMEA` business region\nis now going to two different Google Cloud regions, `us-central1` and\n`europe-west1`. By using Network Topology, you discover that one of\nthe backends is overutilized.\n\n1. You want to check that external traffic that is going through the load\n balancer eventually goes to the correct Google Cloud region. You filter\n the graph to show only the traffic for your external load balancer\n `shopping-site-lb`.\n\n After you apply the filter, Network Topology shows only the\n connections related to the load balancer, as shown in the following example.\n [](/static/network-intelligence-center/docs/network-topology/images/use-cases/auditing-filter.png) Filter for a load balancer (click to enlarge)\n2. You hold the pointer over each business region to highlight the communication\n to that region.\n\n When you hold the pointer over **Americas** and **APAC** , you see traffic\n going to the nearest Google Cloud region: `us-central1` and `asia-\n east1` respectively. However, when you hold the pointer over **EMEA** , you\n see traffic going to `us-central1` and `europe-west1`. Ideally, to reduce\n latency, all traffic from EMEA should go to `europe-west1`.\n3. Next, you click **EMEA** to study the throughput between it and the\n Google Cloud regions. Network Topology overlays bandwidth\n values on each connection. You see that about 0.58 bytes per second is\n going to `us-central1` and 29.9 kilobytes per second is going\n to `europe-west1`. You know that most of the traffic is being directed as\n you would expect, but some traffic is flowing to `us-central1`.\n\n [](/static/network-intelligence-center/docs/network-topology/images/use-cases/auditing-bandwidth.png) Overlaid bandwidth values^1^ (click to enlarge) \n\n ^1^The figure is for reference. Its data doesn't reflect the use\n case.\n4. To investigate further, you expand `us-central1` to view where traffic is\n going. Because there's only one network with a single subnet in that region,\n Network Topology doesn't show those levels of the hierarchy and\n skips to the instance groups.\n\n You see that traffic is going to an instance group that's associated with the load\n balancer's backend service. Because it's a relatively small amount of traffic\n going to `europe-west1`, it's possible that resources in `europe-west1` are\n overutilized and causing traffic to overflow to `us-central1`.\n [](/static/network-intelligence-center/docs/network-topology/images/use-cases/auditing-traffic.png) Traffic path^1^ (click to enlarge) \n\n ^1^The figure is for reference. Its data doesn't reflect the use\n case.\n5. To confirm your conclusion, you expand the `europe-west1` region until you\n reach the instance that is associated with the same load balancer's backend\n service. Network Topology shows time-series charts in the details\n pane for the instance.\n\n In the chart, you notice that the CPU utilization rate is at 81% for the\n instance. The threshold for this example is 80%, indicating that the instance\n is oversubscribed. You resolve this issue by scaling up the instance group so\n that traffic returns to the ideal flow.\n [](/static/network-intelligence-center/docs/network-topology/images/use-cases/auditing-chart.png) Time-series chart for an instance^1^ (click to enlarge) \n\n ^1^The figure is for reference. Its data doesn't reflect the\n use case.\n\nInter-region traffic\n--------------------\n\nIn the following section, you check that internal traffic between regions\nis limited to only database instance traffic.\n\n1. To focus on internal traffic, in the **Topology configuration** list, you select\n only the **Instances** and **Cloud NAT gateways** checkboxes. Because you are only\n viewing traffic within your application, you don't need to see external clients\n and external load balancer traffic.\n\n [](/static/network-intelligence-center/docs/network-topology/images/use-cases/auditing-internalonly.png) Showing internal-only traffic (click to enlarge)\n2. You expand the `asia-east1` region, and you see five instance groups. They are\n not aggregated by network, subnet, or zone because\n they are all in the same network, subnet, and so on.\n\n You notice that only one instance group (`db-group-asia`) contains a path\n for inter-region traffic. All other instance groups are communicating within\n the region.\n\n You continue to expand the `db-group-asia` group until you reach the base\n entity. In this scenario, the base entity is a virtual machine (VM) instance\n (`db-instance-asia`) that acts as a database server. It's communicating with\n other regions to replicate data, which is what you expected, so no further\n investigations are required.\n ̦\n [](/static/network-intelligence-center/docs/network-topology/images/use-cases/auditing-dbtraffic.png) Inter-region traffic^1^ (click to enlarge) \n\n ^1^The figure is for reference. Its data doesn't reflect the\n use case.\n\n \u003cbr /\u003e\n\nWhat's next\n-----------\n\n- [Monitor your networking configuration with Network Topology](/network-intelligence-center/docs/network-topology/how-to/audit-troubleshoot-networking-issues)\n- [Use case: Troubleshoot network connectivity](/network-intelligence-center/docs/network-topology/concepts/troubleshooting-network-connectivity)\n- [Troubleshoot Network Topology](/network-intelligence-center/docs/network-topology/support/troubleshooting)"]]