This document shows how to configure logging and monitoring for system components in Google Distributed Cloud.
The options include the following:
- Cloud Logging and Cloud Monitoring
- Google Cloud Managed Service for Prometheus (Preview)
- Prometheus and Grafana
For more information about the options, see Logging and monitoring overview.
Monitored resources
Monitored resources are how Google represents resources such as clusters, nodes, Pods, and containers. To learn more, refer to Cloud Monitoring's Monitored resource types documentation.
To query for logs and metrics, you'll need to know at least these resource labels:
project_id: Project ID of the cluster's logging-monitoring project. You provided this value in thestackdriver.projectIDfield of your cluster configuration file.location: A Google Cloud region where you want to store Cloud Logging logs and Cloud Monitoring metrics. It's a good idea to choose a region that is near your on-premises data center. You provided this value during installation in thestackdriver.clusterLocationfield of your cluster configuration file.cluster_name: Cluster name that you chose when you created the cluster.You can retrieve the
cluster_namevalue for either the admin or the user cluster by inspecting the Stackdriver custom resource:kubectl get stackdriver stackdriver --namespace kube-system \ --kubeconfig CLUSTER_KUBECONFIG --output yaml | grep 'clusterName:'
where
CLUSTER_KUBECONFIGis the path to the admin cluster's or user cluster's kubeconfig file for which the cluster name is required.
Using Cloud Logging
You don't have to take any action to enable Cloud Logging for a cluster.
However, you must specify the Google Cloud project where you want to view logs. In
the cluster configuration file, you specify the Google Cloud project in
the stackdriver section.
You can access logs using the Logs Explorer in the Google Cloud console. For example, to access a container's logs:
- Open the Logs Explorer in Google Cloud console for your project.
- Find logs for a container by:
- Clicking on the top-left log catalog drop-down box and selecting Kubernetes Container.
- Selecting the cluster name, then the namespace, and then a container from the hierarchy.
Viewing logs for controllers in bootstrap cluster
Find onprem-admin-cluster-controller / clusterapi-controllers pod name
In default, the kind cluster name is
gkectl-bootstrap-cluster."ADMIN_CLUSTER_NAME" resource.type="k8s_container" resource.labels.cluster_name="gkectl-bootstrap-cluster"
Modify the query using the pod name you find, and get the log
resource.type="k8s_container"
resource.labels.cluster_name="gkectl-bootstrap-cluster"
resource.labels.pod_name="POD_NAME"
Using Cloud Monitoring
You don't have to take any action to enable Cloud Monitoring for a cluster.
However, you must specify the Google Cloud project where you want to view metrics.
In the cluster configuration file, you specify the Google Cloud project in
the stackdriver section.
You can choose from over 1,500 metrics by using Metrics Explorer. To access Metrics Explorer, do the following:
In the Google Cloud console, select Monitoring, or use the following button:
Select Resources > Metrics Explorer.
You can also view metrics in dashboards in the Google Cloud console. For information about creating dashboards and viewing metrics, see Creating dashboards.
Viewing fleet-level monitoring data
For an overall view of your fleet's resource utilization using Cloud Monitoring data, including your Google Distributed Cloud, you can use the GKE Enterprise overview in the Google Cloud console. See Use the GKE Enterprise overview to find out more.
Default Cloud Monitoring quota limits
Google Distributed Cloud monitoring has a default limit of 6000 API calls per minute for each project. If you exceed this limit, your metrics may not be displayed. If you need a higher monitoring limit, request a quota adjustment.
Using Managed Service for Prometheus (Preview)
Google Cloud Managed Service for Prometheus is part of Cloud Monitoring and is available as an option. The benefits of Managed Service for Prometheus include the following:
You can continue to use your existing Prometheus based monitoring without altering your alerts and Grafana dashboards.
If you use both GKE and Google Distributed Cloud, you can use the same PromQL for metrics on all your clusters. You can also use the PROMQL tab in Metrics Explorer in the Google Cloud console.
Enabling Managed Service for Prometheus
Open the Stackdriver object named stackdriver for editing:
kubectl --kubeconfig CLUSTER_KUBECONFIG --namespace kube-system \
    edit stackdriver stackdriver
Add the enableGMPForSystemMetrics feature gate, and set it to true:
apiVersion: addons.gke.io/v1alpha1
kind: Stackdriver
metadata:
  name: stackdriver
  namespace: kube-system
spec:
  featureGates:
    enableGMPForSystemMetrics: true
Close your editing session.
Viewing metric data
When Managed Service for Prometheus is enabled, metrics for the following components have a different format for how they are stored and queried in Cloud Monitoring:
- kube-apiserver
- kube-scheduler
- kube-controller-manager
- kubelet and cadvisor
- kube-state-metrics
- node-exporter
In the new format, you can query the preceding metrics by using either PromQL or Monitoring Query Language (MQL).
PromQL example:
histogram_quantile(0.95, sum(rate(apiserver_request_duration_seconds_bucket[5m])) by (le))
To use MQL, set the monitored resource to prometheus_target, and add the
Prometheus type as a suffix to the metric.
MQL example:
fetch prometheus_target
| metric 'kubernetes.io/anthos/apiserver_request_duration_seconds/histogram'
| align delta(5m)
| every 5m
| group_by [], [value_histogram_percentile: percentile(value.histogram, 95)]
Configuring Grafana dashboards with Managed Service for Prometheus
To use Grafana with metrics data from Managed Service for Prometheus, follow the steps in Query using Grafana to authenticate and configure a Grafana data source to query data from Managed Service for Prometheus.
A set of sample Grafana dashboards are provided in the anthos-samples repository on GitHub. To install the sample dashboards, do the following:
Download the sample
.jsonfiles:git clone https://github.com/GoogleCloudPlatform/anthos-samples.git cd anthos-samples/gmp-grafana-dashboards
If your Grafana data source was created with a name different with
Managed Service for Prometheus, change thedatasourcefield in all the.jsonfiles:sed -i "s/Managed Service for Prometheus/[DATASOURCE_NAME]/g" ./*.json
Replace [DATASOURCE_NAME] with the name of the data source in your Grafana that was pointed to the Prometheus
frontendservice.Access Grafana UI from your browser, and select + Import under the Dashboards menu.
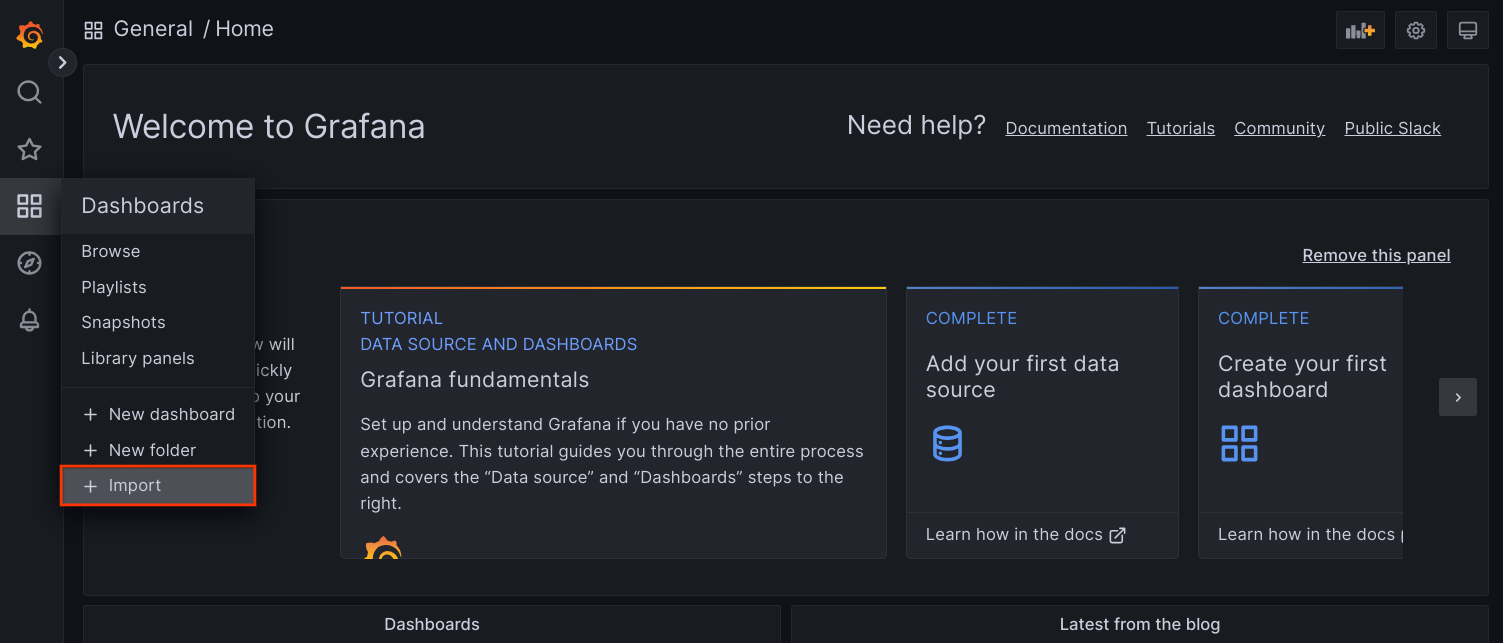
Either upload the
.jsonfile, or copy and paste the file content and select Load. Once the file content is successfully loaded, select Import. Optionally you can also change the dashboard name and UID before importing.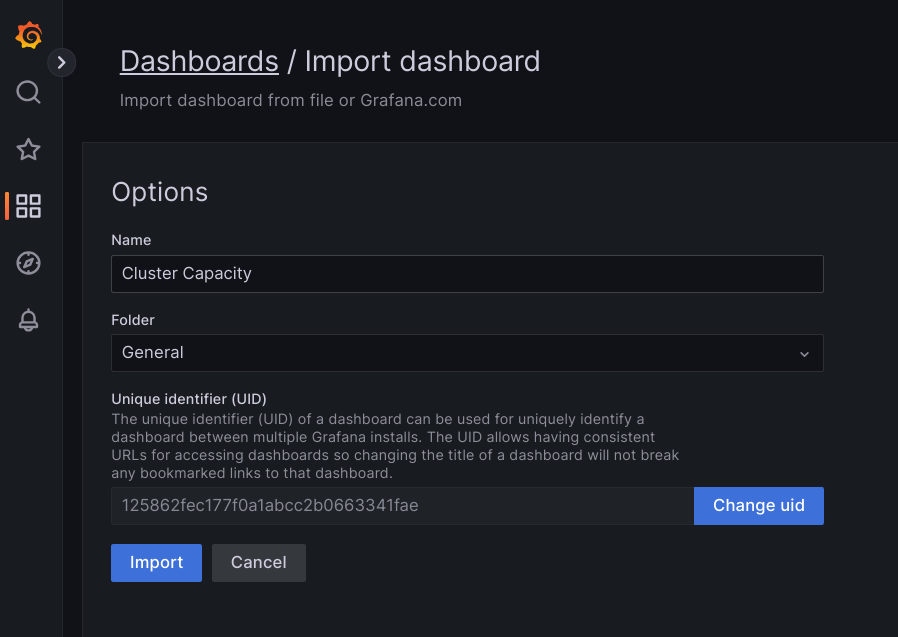
The imported dashboard should load successfully if your Google Distributed Cloud and the data source are configured correctly. For example, the following screenshot shows the dashboard configured by
cluster-capacity.json.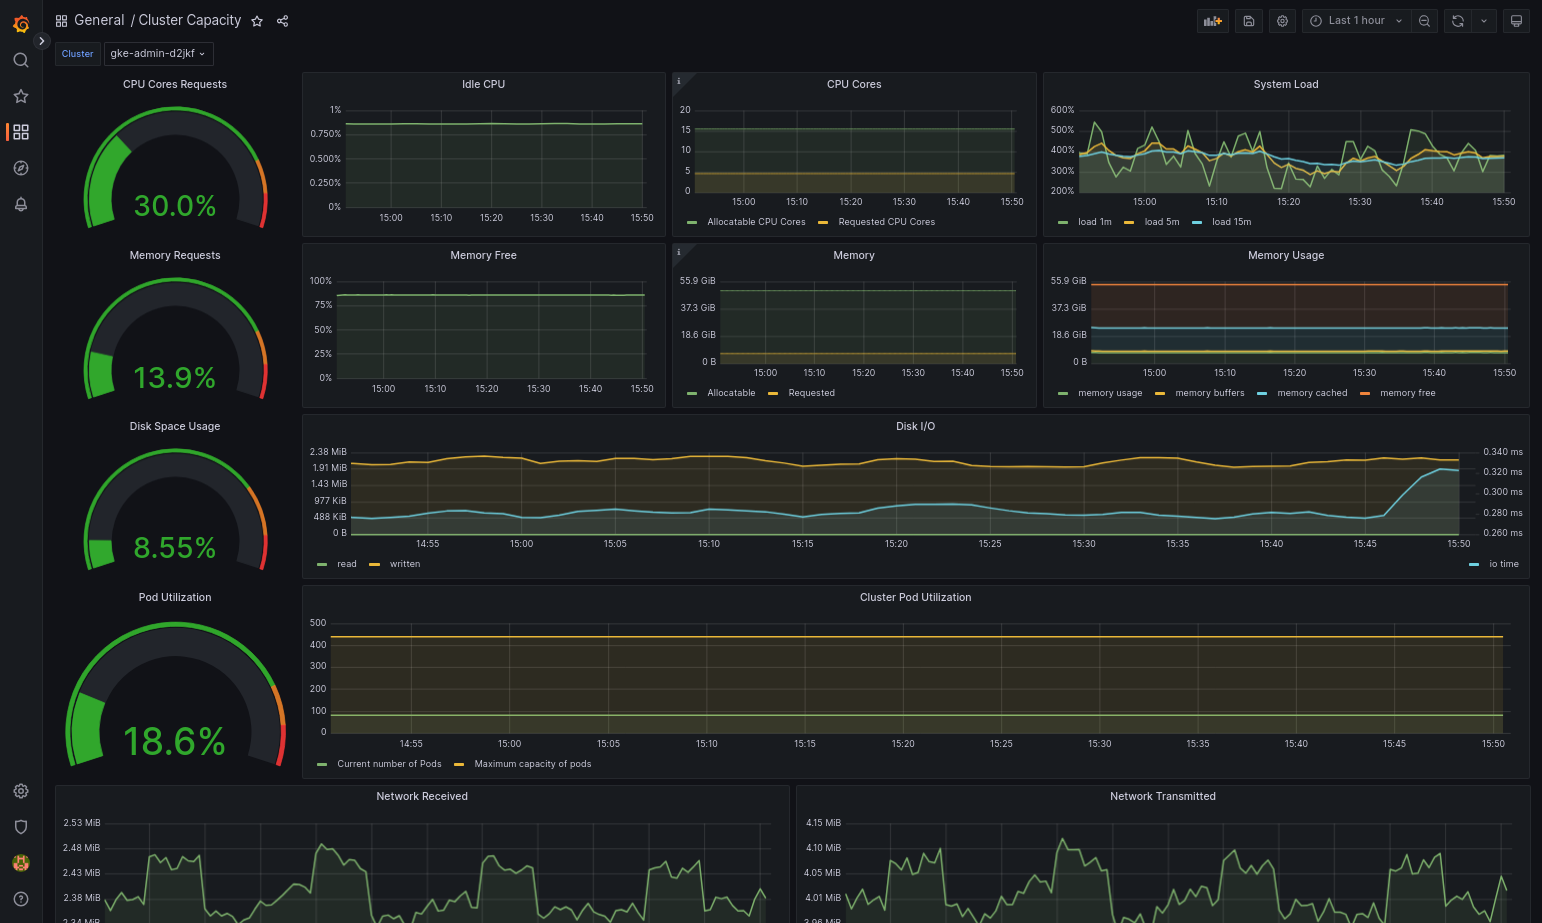
Additional resources
For more information about Managed Service for Prometheus, see the following:
Using Prometheus and Grafana
To enable Prometheus and Grafana, open the Monitoring object named
monitoring-sample for editing:
kubectl --kubeconfig [USER_CLUSTER_KUBECONFIG] edit \
    monitoring monitoring-sample --namespace kube-system
Set enablePrometheus to true:
apiVersion: addons.gke.io/v1alpha1
   kind: Monitoring
   metadata:
     labels:
       k8s-app: monitoring-operator
     name: monitoring-sample
     namespace: kube-system
   spec:
     channel: stable
     ...
     enablePrometheus: false
Close your editing session.
Known issue
In user clusters, Prometheus and Grafana get automatically disabled during upgrade. However, the configuration and metrics data are not lost.
To work around this issue, after the upgrade, open monitoring-sample for
editing and set enablePrometheus to true.
Accessing monitoring metrics from Grafana dashboards
Grafana displays metrics gathered from your clusters. To view these metrics, you need to access Grafana's dashboards:
Get the name of the Grafana Pod running in a user cluster's
kube-systemnamespace:kubectl --kubeconfig [USER_CLUSTER_KUBECONFIG] -n kube-system get pods
where [USER_CLUSTER_KUBECONFIG] is the user cluster's kubeconfig file.
The Grafana Pod has an HTTP server listening on TCP localhost port 3000. Forward a local port to port 3000 in the Pod, so that you can view Grafana's dashboards from a web browser.
For example, suppose the name of the Pod is
grafana-0. To forward port 50000 to port 3000 in the Pod, enter this command::kubectl --kubeconfig [USER_CLUSTER_KUBECONFIG] -n kube-system port-forward grafana-0 50000:3000
From a web browser, navigate to
http://localhost:50000.On the login page, enter
adminfor username and password.If login is successful, you will see a prompt to change the password. After you have changed the default password, the user cluster's Grafana Home Dashboard should load.
To access other dashboards, click the Home drop-down menu in the top-left corner of the page.
For an example of using Grafana, see Create a Grafana dashboard.
Accessing alerts
Prometheus Alertmanager collects alerts from the Prometheus server. You can view these alerts in a Grafana dashboard. To view the alerts, you need to access the dashboard:
The container in the
alertmanager-0Pod listens on TCP port 9093. Forward a local port to port 9093 in the Pod:kubectl --kubeconfig [USER_CLUSTER_KUBECONFIG] port-forward \ -n kube-system alertmanager-0 50001:9093
From a web browser, navigate to
http://localhost:50001.
Changing Prometheus Alertmanager configuration
You can change Prometheus Alertmanager's default configuration by editing your
user cluster's monitoring.yaml file. You should do this if you want to direct
alerts to a specific destination, rather than keep them in the dashboard. You
can learn how to configure Alertmanager in Prometheus'
Configuration documentation.
To change the Alertmanager configuration, perform the following steps:
Make a copy of the user cluster's
monitoring.yamlmanifest file:kubectl --kubeconfig [USER_CLUSTER_KUBECONFIG] -n kube-system \ get monitoring monitoring-sample -o yaml > monitoring.yaml
To configure Alertmanager, make changes to the fields under
spec.alertmanager.yml. When you're finished, save the changed manifest.Apply the manifest to your cluster:
kubectl apply --kubeconfig [USER_CLUSTER_KUBECONIFG] -f monitoring.yaml
Scaling Prometheus resources
The default monitoring configuration supports up to five nodes. For larger clusters, you can adjust the Prometheus Server resources. The recommendation is 50m cores of CPU and 500Mi of memory per cluster node. Make sure that your cluster contains two nodes, each with sufficient resources to fit Prometheus. For more information, refer to Resizing a user cluster.
To change Prometheus Server resources, perform the following steps:
Make a copy of the user cluster's
monitoring.yamlmanifest file:kubectl --kubeconfig [USER_CLUSTER_KUBECONFIG] -n kube-system get monitoring monitoring-sample -o yaml > monitoring.yaml
To override resources, make changes to the fields under
spec.resourceOverride. When you're finished, save the changed manifest. Example:spec: resourceOverride: - component: Prometheus resources: requests: cpu: 300m memory: 3000Mi limits: cpu: 300m memory: 3000MiApply the manifest to your cluster:
kubectl --kubeconfig [USER_CLUSTER_KUBECONFIG] apply -f monitoring.yaml
Create a Grafana dashboard
You've deployed an application that exposes a metric, verified that the metric is exposed, and verified that Prometheus scrapes the metric. Now you can add the application-level metric to a custom Grafana dashboard.
To create a Grafana dashboard, perform the following steps:
- If necessary, gain access to Grafana.
- From the Home Dashboard, click the Home drop-down menu in the top-left corner of the page.
- From the right-side menu, click New dashboard.
- From the New panel section, click Graph. An empty graph dashboard appears.
- Click Panel title, then click Edit. The bottom Graph panel opens to the Metrics tab.
- From the Data Source drop-down menu, select user. Click Add
query, and enter
fooin the search field. - Click the Back to dashboard button in the top-right corner of the screen. Your dashboard is displayed.
- To save the dashboard, click Save dashboard in the top-right corner of the screen. Choose a name for the dashboard, then click Save.
Disabling Prometheus and Grafana
To disable in-cluster monitoring, revert the changes made to the
monitoring-sample object:
Open the
monitoring-sampleobject for editing:kubectl --kubeconfig USER_CLUSTER_KUBECONFIG edit \ monitoring monitoring-sample --namespace kube-system
Replace USER_CLUSTER_KUBECONFIG with the kubeconfig file for your user cluster.
To disable Prometheus and Grafana, set
enablePrometheustofalse:apiVersion: addons.gke.io/v1alpha1 kind: Monitoring metadata: labels: k8s-app: monitoring-operator name: monitoring-sample namespace: kube-system spec: channel: stable ... enablePrometheus: falseSave your changes by closing the editing session.
Confirm that the
prometheus-0,prometheus-1andgrafana-0statefulsets have been deleted:kubectl --kubeconfig USER_CLUSTER_KUBECONFIG get pods --namespace kube-system
Example: Adding application-level metrics to a Grafana dashboard
The following sections walk you through adding metrics for an application. In this section, you complete the following tasks:
- Deploy an example application that exposes a metric called
foo. - Verify that Prometheus exposes and scrapes the metric.
- Create a custom Grafana dashboard.
Deploy the example application
The example application runs in a single Pod. The Pod's container exposes a
metric, foo, with a constant value of 40.
Create the following Pod manifest, pro-pod.yaml:
apiVersion: v1
kind: Pod
metadata:
  name: prometheus-example
  annotations:
    prometheus.io/scrape: 'true'
    prometheus.io/port: '8080'
    prometheus.io/path: '/metrics'
spec:
  containers:
  - image: registry.k8s.io/prometheus-dummy-exporter:v0.1.0
    name: prometheus-example
    command:
    - /bin/sh
    - -c
    - ./prometheus_dummy_exporter --metric-name=foo --metric-value=40 --port=8080
Then apply the Pod manifest to your user cluster:
kubectl --kubeconfig [USER_CLUSTER_KUBECONFIG] apply -f pro-pod.yaml
Verify that the metric is exposed and scraped
The container in the
prometheus-examplepod listens on TCP port 8080. Forward a local port to port 8080 in the Pod:kubectl --kubeconfig [USER_CLUSTER_KUBECONFIG] port-forward prometheus-example 50002:8080
To verify that the application exposes the metric, run the following command:
curl localhost:50002/metrics | grep fooThe command returns the following output:
# HELP foo Custom metric
# TYPE foo gauge
foo 40
The container in the
prometheus-0Pod listens on TCP port 9090. Forward a local port to port 9090 in the Pod:kubectl --kubeconfig [USER_CLUSTER_KUBECONFIG] port-forward prometheus-0 50003:9090
To verify that Prometheus is scraping the metric, navigate to http://localhost:50003/targets, which should take you to the
prometheus-0Pod under theprometheus-io-podstarget group.To view metrics in Prometheus, navigate to http://localhost:50003/graph. From the search field, enter
foo, then click Execute. The page should display the metric.
Configuring the Stackdriver custom resource
When you create a cluster, Google Distributed Cloud automatically creates a Stackdriver custom resource. You can edit the spec in the custom resource to override the default values for CPU and memory requests and limits for a Stackdriver component, and you can separately override the default storage size and storage class.
Override default values for requests and limits for CPU and memory
To override these defaults, do the following:
Open your Stackdriver custom resource in a command line editor:
kubectl --kubeconfig=KUBECONFIG -n kube-system edit stackdriver stackdriver
where KUBECONFIG is the path to your kubeconfig file for the cluster. This can be either an admin cluster or user cluster.
In the Stackdriver custom resource, add the
resourceAttrOverridefield under thespecsection:resourceAttrOverride: POD_NAME_WITHOUT_RANDOM_SUFFIX/CONTAINER_NAME: LIMITS_OR_REQUESTS: RESOURCE: RESOURCE_QUANTITYNote that the
resourceAttrOverridefield overrides all existing default limits and requests for the component you specify. An example file looks like the following:apiVersion: addons.gke.io/v1alpha1 kind: Stackdriver metadata: name: stackdriver namespace: kube-system spec: projectID: my-project clusterName: my-cluster clusterLocation: us-west-1a resourceAttrOverride: stackdriver-prometheus-k8s/prometheus-server: limits: cpu: 500m memory: 3000Mi requests: cpu: 300m memory: 2500MiSave changes and quit your command line editor.
Check the health of your Pods:
kubectl --kubeconfig=KUBECONFIG -n kube-system get pods | grep stackdriver
For example, a healthy Pod looks like the following:
stackdriver-prometheus-k8s-0 2/2 Running 0 5d19h
Check the Pod spec of the component to make sure the resources are set correctly.
kubectl --kubeconfig=KUBECONFIG -n kube-system describe pod POD_NAME
where
POD_NAMEis the name of the Pod you just changed. For example,stackdriver-prometheus-k8s-0The response looks like the following:
  Name:         stackdriver-prometheus-k8s-0
  Namespace:    kube-system
  ...
  Containers:
    prometheus-server:
      Limits:
        cpu: 500m
        memory: 3000Mi
      Requests:
        cpu: 300m
        memory: 2500Mi
      ...
Override storage size defaults
To override these defaults, do the following:
Open your Stackdriver custom resource in a command line editor:
kubectl --kubeconfig=KUBECONFIG -n kube-system edit stackdriver stackdriver
Add the
storageSizeOverridefield under thespecsection. You can use the componentstackdriver-prometheus-k8sorstackdriver-prometheus-app. The section takes this format:storageSizeOverride: STATEFULSET_NAME: SIZE
This example uses the statefulset
stackdriver-prometheus-k8sand size120Gi.apiVersion: addons.gke.io/v1alpha1 kind: Stackdriver metadata: name: stackdriver namespace: kube-system spec: projectID: my-project clusterName: my-cluster clusterLocation: us-west-1a storageSizeOverride: stackdriver-prometheus-k8s: 120GiSave, and quit your command line editor.
Check the health of your Pods:
kubectl --kubeconfig=KUBECONFIG -n kube-system get pods | grep stackdriver
stackdriver-prometheus-k8s-0 2/2 Running 0 5d19h
Check the Pod spec of the component to make sure the storage size is correctly overridden.
kubectl --kubeconfig=KUBECONFIG -n kube-system describe statefulset STATEFULSET_NAME
The response looks like the following:
Volume Claims:
 Name:          my-statefulset-persistent-volume-claim
 StorageClass:  my-storage-class
 Labels:
 Annotations:
 Capacity:      120Gi
 Access Modes:  [ReadWriteOnce]
Override storage class defaults
Prerequisite
You must first create a StorageClass you want to use.
To override the default storage class for persistent volumes claimed by logging and monitoring components:
Open your Stackdriver custom resource in a command line editor:
kubectl --kubeconfig=KUBECONFIG -n kube-system edit stackdriver stackdriver
where KUBECONFIG is the path to your kubeconfig file for the cluster. This can be either an admin cluster or user cluster.
Add the
storageClassNamefield under thespecsection:storageClassName: STORAGECLASS_NAME
Note that the
storageClassNamefield overrides the existing default storage class, and applies to all logging and monitoring components with persistent volumes claimed. An example file looks like the following:apiVersion: addons.gke.io/v1alpha1 kind: Stackdriver metadata: name: stackdriver namespace: kube-system spec: projectID: my-project clusterName: my-cluster clusterLocation: us-west-1a proxyConfigSecretName: my-secret-name enableVPC:
optimizedMetrics: true storageClassName: my-storage-class Save changes.
Check the health of your Pods:
kubectl --kubeconfig=KUBECONFIG -n kube-system get pods | grep stackdriver
For example, a healthy Pod looks like the following:
stackdriver-prometheus-k8s-0 1/1 Running 0 5d19h
Check the Pod spec of a component to make sure the storage class is set correctly.
kubectl --kubeconfig=KUBECONFIG -n kube-system describe statefulset STATEFULSET_NAME
For example, using the stateful set
stackdriver-prometheus-k8s, the response looks like the following:Volume Claims: Name: stackdriver-prometheus-data StorageClass: my-storage-class Labels: Annotations: Capacity: 120Gi Access Modes: [ReadWriteOnce]
Disable optimized metrics
By default, the metrics agents running in the cluster collect and report an optimized set of container, kubelet and kube-state-metrics metrics to Stackdriver. If you require additional metrics, we recommend that you find a replacement from the list of GKE Enterprise metrics.
Here are some examples of replacements you might use:
| Disabled metric | Replacements |
|---|---|
kube_pod_start_time |
container/uptime |
kube_pod_container_resource_requests |
container/cpu/request_cores container/memory/request_bytes |
kube_pod_container_resource_limits |
container/cpu/limit_cores container/memory/limit_bytes |
To disable the optimized kube-state-metrics metrics default setting (not recommended), do the following:
Open your Stackdriver custom resource in a command line editor:
kubectl --kubeconfig=KUBECONFIG -n kube-system edit stackdriver stackdriver
where KUBECONFIG is the path to your kubeconfig file for the cluster. This can be either an admin cluster or user cluster.
Set the
optimizedMetricsfield tofalse:apiVersion: addons.gke.io/v1alpha1 kind: Stackdriver metadata: name: stackdriver namespace: kube-system spec: projectID: my-project clusterName: my-cluster clusterLocation: us-west-1a proxyConfigSecretName: my-secret-name enableVPC:
optimizedMetrics: false storageClassName: my-storage-class Save changes, and quit your command line editor.
Known issue: Cloud Monitoring error condition
(Issue ID 159761921)
Under certain conditions, the default Cloud Monitoring pod,
deployed by default in each new cluster, can become unresponsive.
When clusters are upgraded, for example, storage data can become
corrupted when pods in statefulset/prometheus-stackdriver-k8s are restarted.
Specifically, monitoring pod stackdriver-prometheus-k8s-0 can be
caught in a loop when corrupted data prevents prometheus-stackdriver-sidecar
writing to the cluster storage PersistentVolume.
You can manually diagnose and recover the error following the steps below.
Diagnosing the Cloud Monitoring failure
When the monitoring pod has failed, the logs will report the following:
{"log":"level=warn ts=2020-04-08T22:15:44.557Z caller=queue_manager.go:534 component=queue_manager msg=\"Unrecoverable error sending samples to remote storage\" err=\"rpc error: code = InvalidArgument desc = One or more TimeSeries could not be written: One or more points were written more frequently than the maximum sampling period configured for the metric.: timeSeries[0-114]; Unknown metric: kubernetes.io/anthos/scheduler_pending_pods: timeSeries[196-198]\"\n","stream":"stderr","time":"2020-04-08T22:15:44.558246866Z"}
{"log":"level=info ts=2020-04-08T22:15:44.656Z caller=queue_manager.go:229 component=queue_manager msg=\"Remote storage stopped.\"\n","stream":"stderr","time":"2020-04-08T22:15:44.656798666Z"}
{"log":"level=error ts=2020-04-08T22:15:44.663Z caller=main.go:603 err=\"corruption after 29032448 bytes: unexpected non-zero byte in padded page\"\n","stream":"stderr","time":"2020-04-08T22:15:44.663707748Z"}
{"log":"level=info ts=2020-04-08T22:15:44.663Z caller=main.go:605 msg=\"See you next time!\"\n","stream":"stderr","time":"2020-04-08T22:15:44.664000941Z"}
Recovering from the Cloud Monitoring error
To recover Cloud Monitoring manually:
Stop cluster monitoring. Scale down the
stackdriveroperator to prevent monitoring reconciliation:kubectl --kubeconfig /ADMIN_CLUSTER_KUBCONFIG --namespace kube-system scale deployment stackdriver-operator --replicas 0
Delete the monitoring pipeline workloads:
kubectl --kubeconfig /ADMIN_CLUSTER_KUBCONFIG --namespace kube-system delete statefulset stackdriver-prometheus-k8s
Delete the monitoring pipeline PersistentVolumeClaims (PVCs):
kubectl --kubeconfig /ADMIN_CLUSTER_KUBCONFIG --namespace kube-system delete pvc -l app=stackdriver-prometheus-k8s
Restart cluster monitoring. Scale up the stackdriver operator to reinstall a new monitoring pipeline and resume reconciliation:
kubectl --kubeconfig /ADMIN_CLUSTER_KUBCONFIG --namespace kube-system scale deployment stackdriver-operator --replicas=1