简介
对数十亿个时序进行预测和异常检测需要大量的计算资源。大多数现有系统会将预测和异常检测作为批量作业运行(例如风险流水线、流量预测、需求规划等)。这会严重限制您可以在线执行的分析类型,例如根据一组事件维度中的突然增加或减少情况决定是否发出提醒。
Timeseries Insights API 的主要目标如下:
- 可扩展到数十亿个时序,这些时序是根据查询参数从原始事件及其属性动态构建的。
- 提供实时预测和异常值检测结果。也就是说,在几秒钟内,检测所有时序的趋势和季节性变化,并确定是否有任何 Slice 出现意外的激增或下降。
API 功能
- 管理数据集
- 将由 Cloud Storage 中存储的多个数据源组成的数据集编入索引并加载。允许以流式方式附加新事件。
- 卸载不再需要的数据集。
- 询问数据集的处理状态。
- 查询数据集
- 检索与给定属性值匹配的时序。系统会预测时序到指定的时间范围。系统还会评估时间序列是否存在异常。
- 自动检测属性值组合是否存在异常。
- 更新数据集
- 提取最近发生的新事件,并将其近乎实时(延迟几秒到几分钟)纳入索引。
灾难恢复
Timeseries Insights API 不能用作 Cloud Storage 的备份,也不会返回原始的流式更新。客户负责单独存储和备份数据。
区域服务中断后,该服务会尽力恢复。在服务中断开始后的 24 小时内更新的元数据(与数据集和运行状况相关的信息)和流式传输的用户数据可能无法恢复。
在恢复期间,对数据集的查询和流式更新可能不可用。
输入数据
通常,系统会随时间的推移收集数字和分类数据。例如,下图显示了数据中心中单个正在运行的作业的 CPU 使用率、内存用量和状态,以及在一段时间内每分钟的变化情况。CPU 用量和内存用量是数值,状态是分类值。
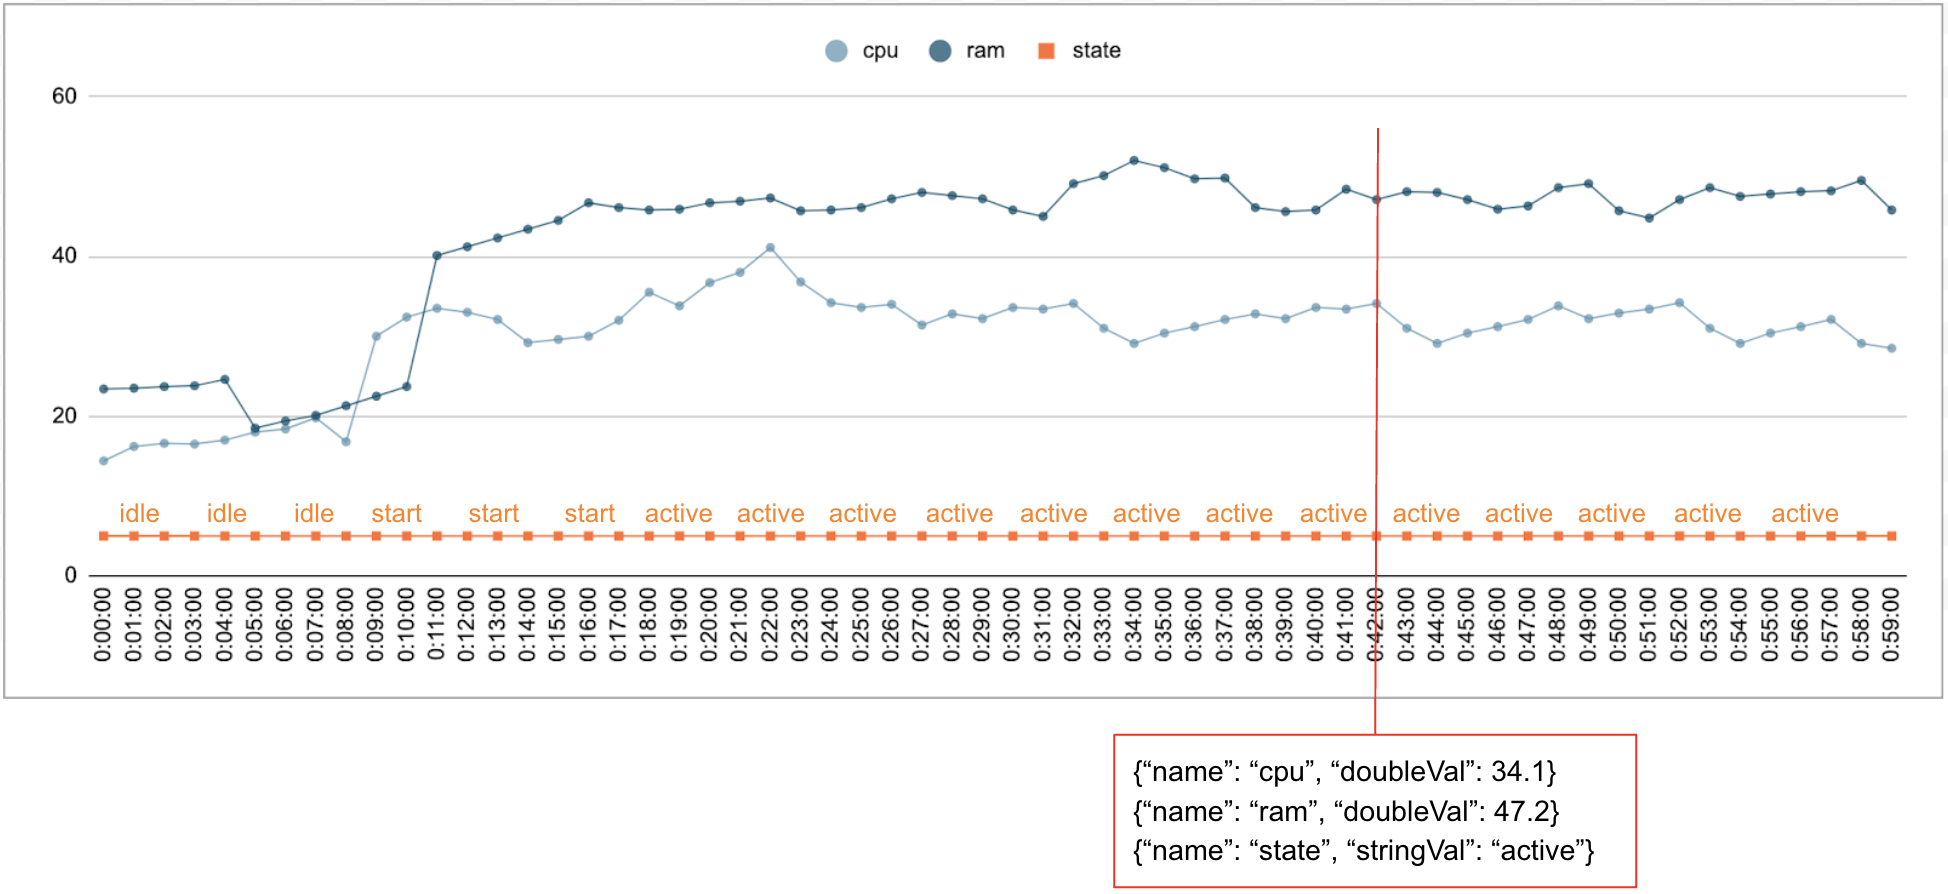
事件
Timeseries Insights API 使用事件作为基本数据条目。每个事件都有一个时间戳和一组维度,即键值对,其中键是维度名称。这种简单的表示法使我们能够处理规模达到数万亿级的数据。例如,系统会包含数据中心、用户、作业名称和任务编号,以便全面表示单个事件。上图显示了为单个作业记录的一系列事件,其中展示了部分维度。
{"name":"user","stringVal":"user_64194"},
{"name":"job","stringVal":"job_45835"},
{"name":"data_center","stringVal":"data_center_30389"},
{"name":"task_num","longVal":19},
{"name":"cpu","doubleVal":3840787.5207877564},
{"name":"ram","doubleVal":1067.01},
{"name":"state","stringVal":"idle"}
DataSet
DataSet 是一系列事件。查询在同一数据集中执行。每个项目可以有多个数据集。
数据集是基于批量数据和流式数据构建的。批量数据构建会从多个 Cloud Storage URI 读取数据源。批量构建完成后,您可以使用流式数据更新数据集。通过对历史数据使用批量构建,系统可以避免冷启动问题。
数据集需要先构建或编入索引,然后才能查询或更新。索引编制会在创建数据集时开始,通常需要几分钟到几小时才能完成,具体取决于数据量。更具体地说,在初始编入索引期间,系统会扫描一次数据源。如果 Cloud Storage URI 的内容在初始索引编制完成后发生更改,系统不会再次扫描这些 URI。使用流式更新获取更多数据。流式更新会近乎实时地持续编入索引。
时间序列和异常检测
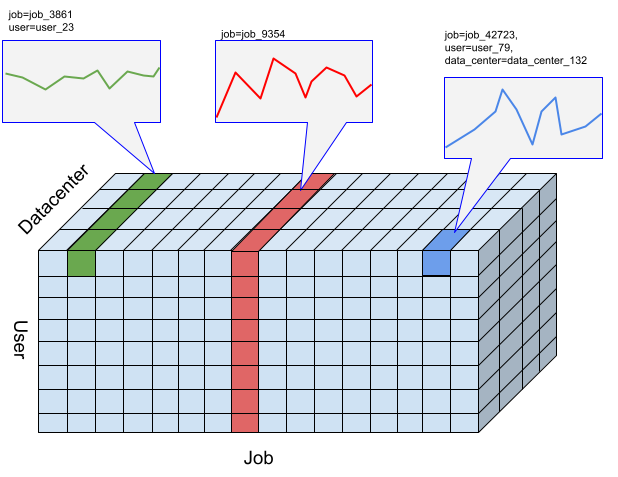
对于 Timeseries Insights API,slice 是指具有特定维度值组合的事件集合。我们希望衡量一段时间内落入这些时间段的事件。
对于给定时间段,系统会按用户指定的时间间隔分辨率将事件汇总为数值,这些数值就是用于检测异常的时序。上图展示了“user”“job”和“data_center”维度的不同组合所产生的不同 Slice 选项。
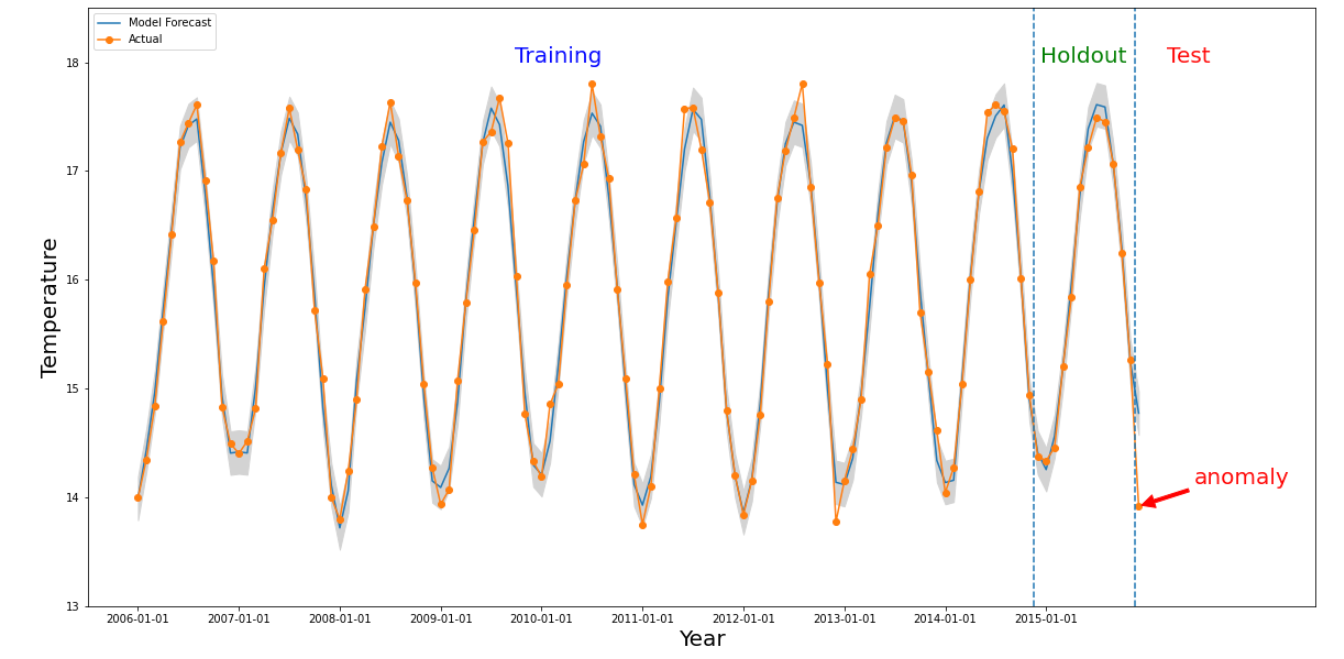
如果感兴趣的时间段内的数值与过去的值明显不同,则某个时间段会出现异常。上图显示了根据世界各地 10 多年来测量的温度绘制的时序。假设我们想了解 2015 年的最后一个月是否异常。向系统发出查询时,将感兴趣的时间 detectionTime 指定为“2015/12/01”,将 granularity 指定为“1 个月”。在 detectionTime 之前检索到的时序会划分为较早的训练期和随后的留存期。系统会使用训练期的数据训练模型,并使用留出期数据验证模型能否可靠地预测下一个值。在此示例中,预留期为 1 年。此图片显示了模型的实际数据和预测值,以及上下限。2015 年 12 月的温度被标记为异常,因为实际值超出了预测边界。